
Archaeological Graphical Survey of Giant’s Castle Maze
In order to better understand the Giant’s Castle Maze site, in addition to the LiDAR, photogrammetry and earth energy surveys, we conducted a graphical survey of the site.
Me and Teän did this ourselves, rather than bringing someone in to help us like for the other survey methods. This was because we already had some experience carrying out this kind of survey. Back in the Autumn of 2024, Cathy Parkes, senior archaeologist with Cornwall Archaeological Unit, came to Scilly to conduct fieldwork for her project Porths and Gigs of the Isles of Scilly - an overview of the archeology associated with pilot gig rowing on Scilly. This included old gig sheds (some of which are almost invisible now), slipways, and drangs (intentionally cleared water pathways leading to/from gig sheds, allowing gigs to quickly access the sea). This fascinating project provided insight into a practice that was central to island life for centuries, and has hugely impacted the culture of Scilly today. More information can be found here:
https://pyscajor.github.io/PorthsAndGigs/
To assist with this project, she was accompanied by landscape surveyor Mark Bowden, who worked for over 30 years for Historic England and its predecessor bodies as a landscape archaeology surveyor and investigator. He was conducting traditional plane table and graphical surveys of some of these sites, to be included in Cathy’s report. Myself and Teän were both lucky enough to assist them with this work for a couple of days. During this time, we got to see first-hand the elegantly simple and effective methods by which archaeological sites can be recorded with only analogue equipment.
Mark worked carefully and efficiently, beginning by setting up a base line from which all subsequent measurements were taken. For a smaller site, it was enough to take measurements of the distances of key features from this, scaling them down, and plotting them onto the drawing board. For larger sites, a plane table was used, carefully leveled, and an optical tool called an alidade was used to accurately transcribe the angles that key features lay from the baseline. In both methods, a careful measuring, checking, and plotting of points on the drawing board eventually built up a picture of the site.
It is a process that involves a degree of subjectivity- it is up to the surveyor to decide, for example, where exactly a slope begins or ends. These decisions are made to best communicate what is really going on at the site, which is figured out with a lot of walking back and forth, stamping down plants, and booting stones to see if they move. Mark explained that this was an advantage of these old methods in an era of quick and easy digital surveying- the communication by the surveyor of their actual experience of the site, rather than the surface-level overview of a digital scan.
We were both very inspired after our experience volunteering with Cathy and Mark. We decided that it would be worth doing a graphical survey of the Giant’s Castle site, that it might be an important supplement to Tom Goscar’s fantastic scans.

Teän helping survey a drang on St. Agnes…

Layan and Mark surveying a disused gig shed on Bryher…
We further familiarised ourselves with the method using the highly useful, and free, Graphical and Plane Table Survey of Archaeological Earthworks guidance from Historic England, which can be found at:
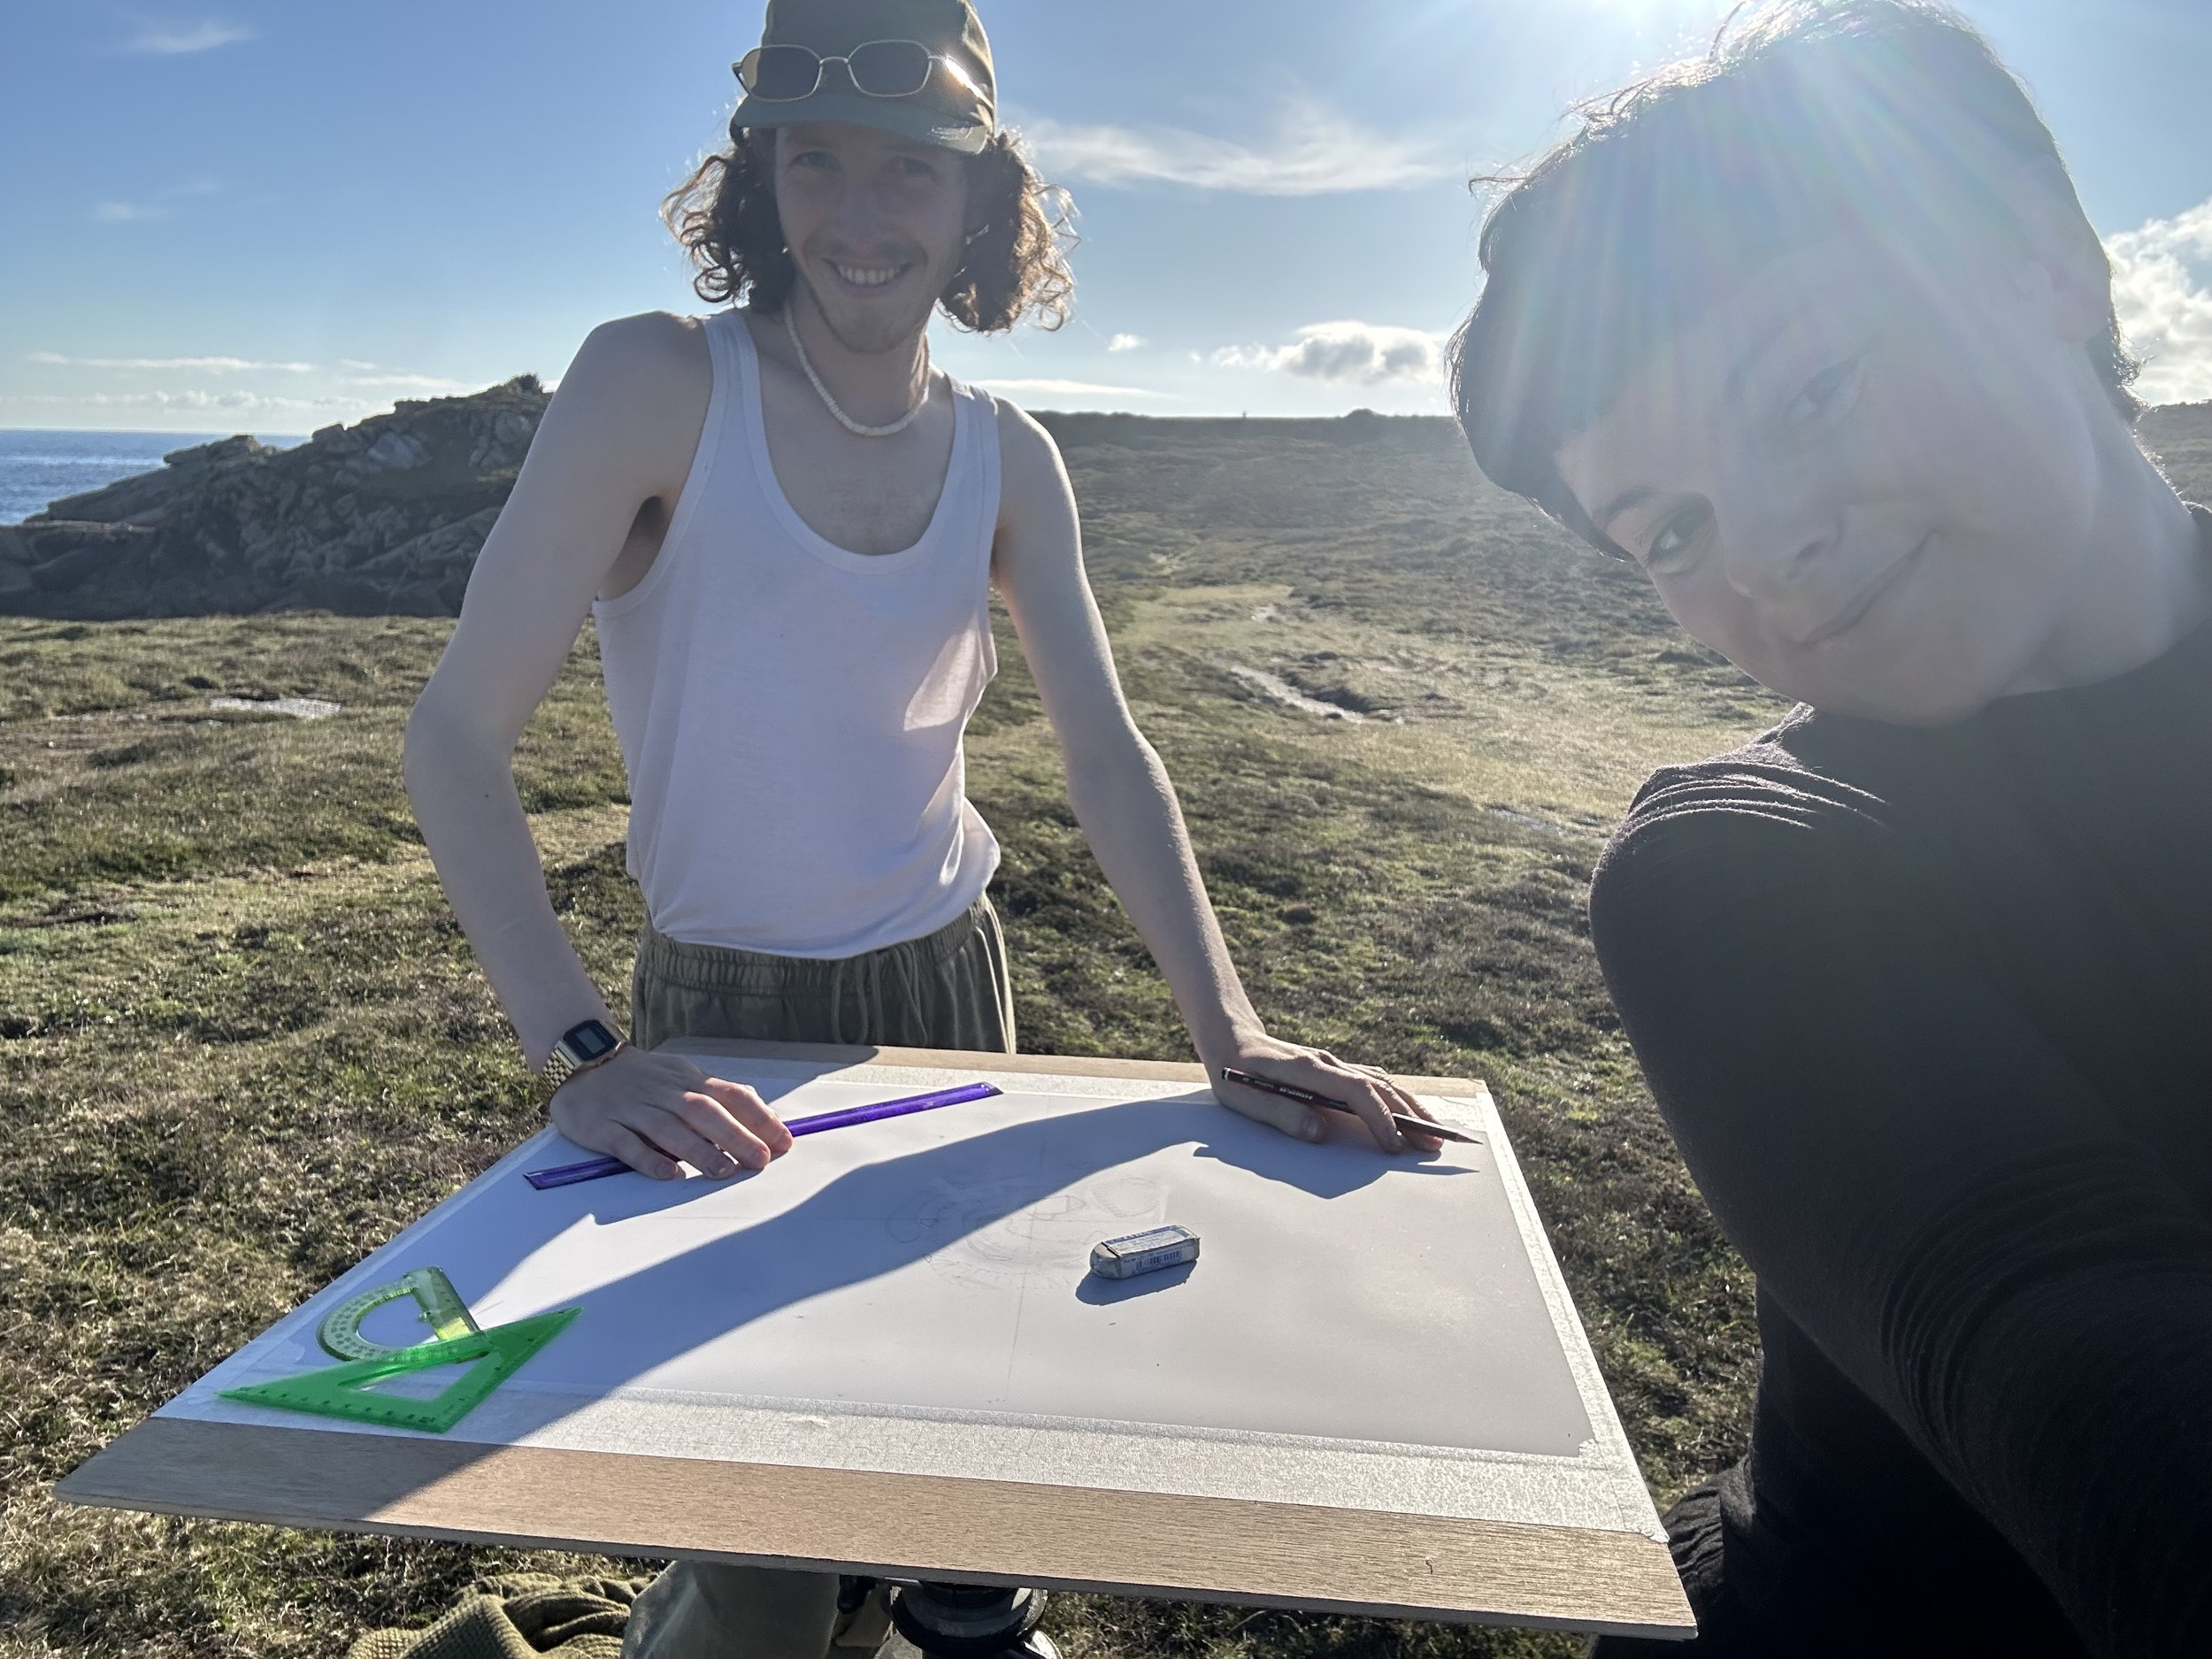
We ordered a pair of surveyor’s tape measures, and some drafting film (thin sheets of matte plastic, used for drawing on instead of paper as it won’t shrink or move even if wet. It makes a suprisingly good drawing surface for a hard pencil). We stuck a piece of thin ply onto a tripod for a drawing board, and bought a bright pink plastic set square from the newsagents in town. We loaded up on tea and biscuits, and set off.
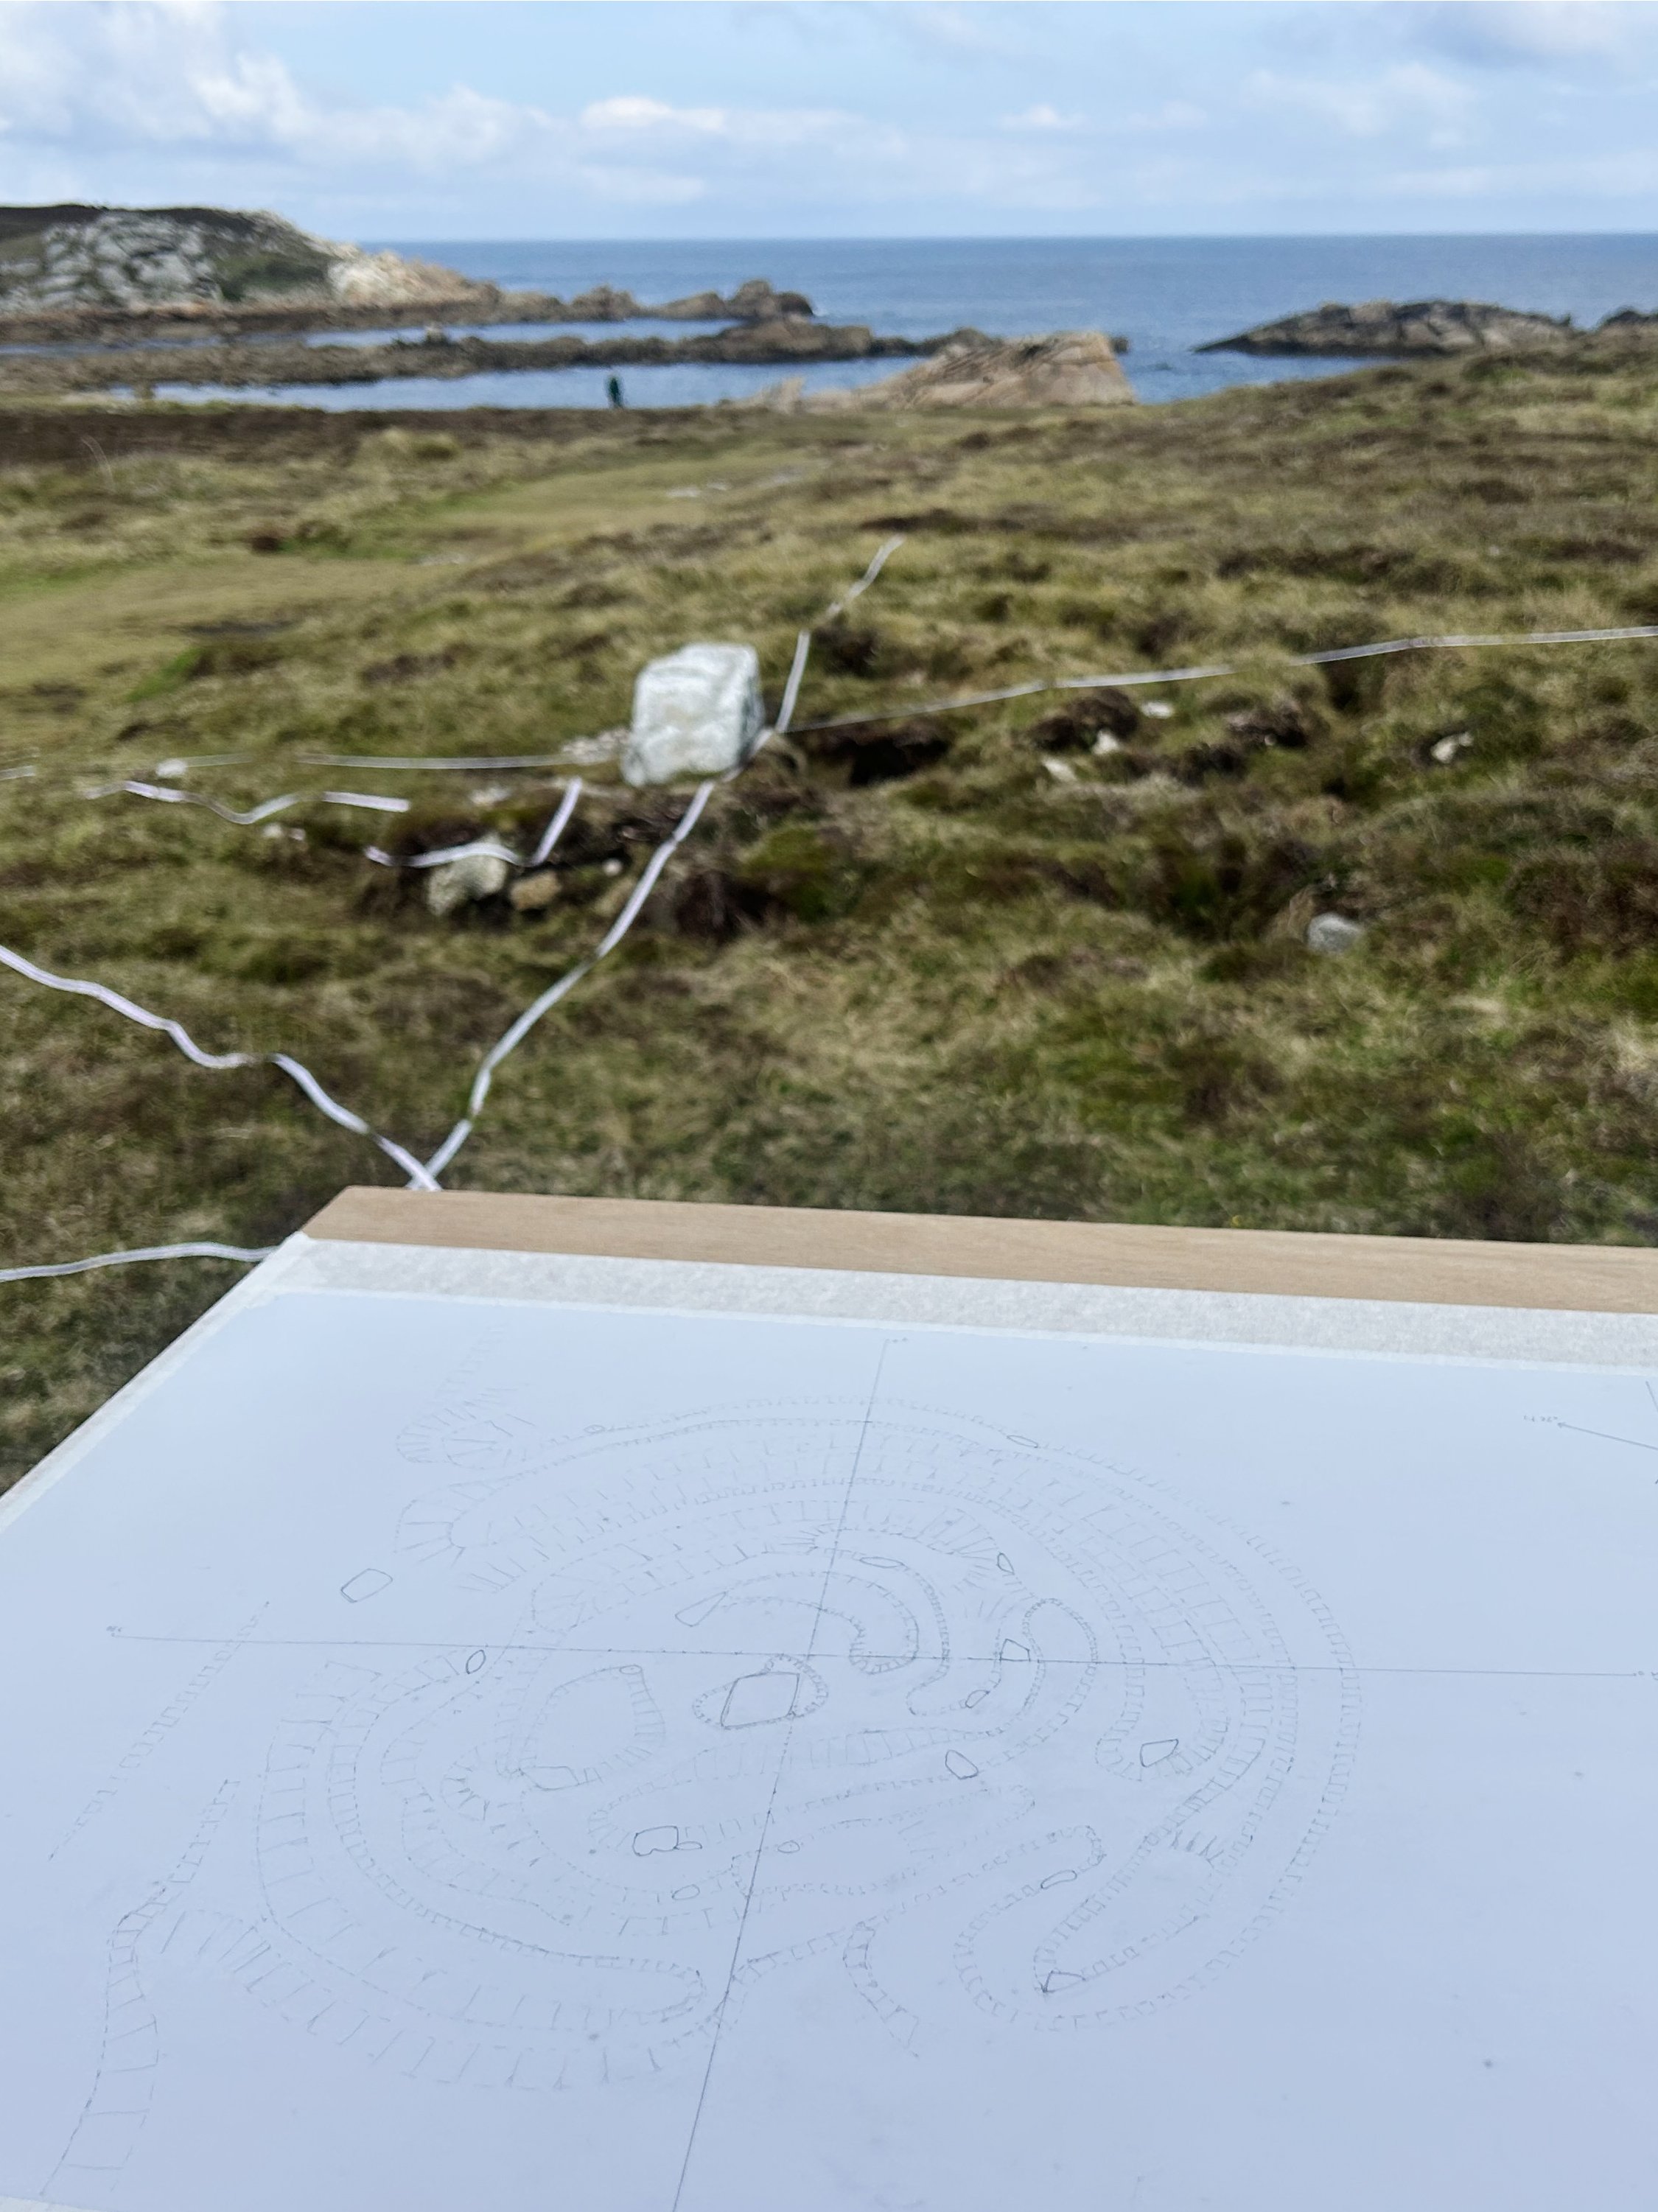
As Giant’s Castle Maze is a comparatively small site to survey (Mark often surveys sites measured in many tens of meters), we decided a plane table and alidade would be unneccessary. We began by establishing a base line- laying one tape measure right through the center of the maze. We then laid another through the center perpendicular to this, making a cross. I then replicated this cross on the drawing board.
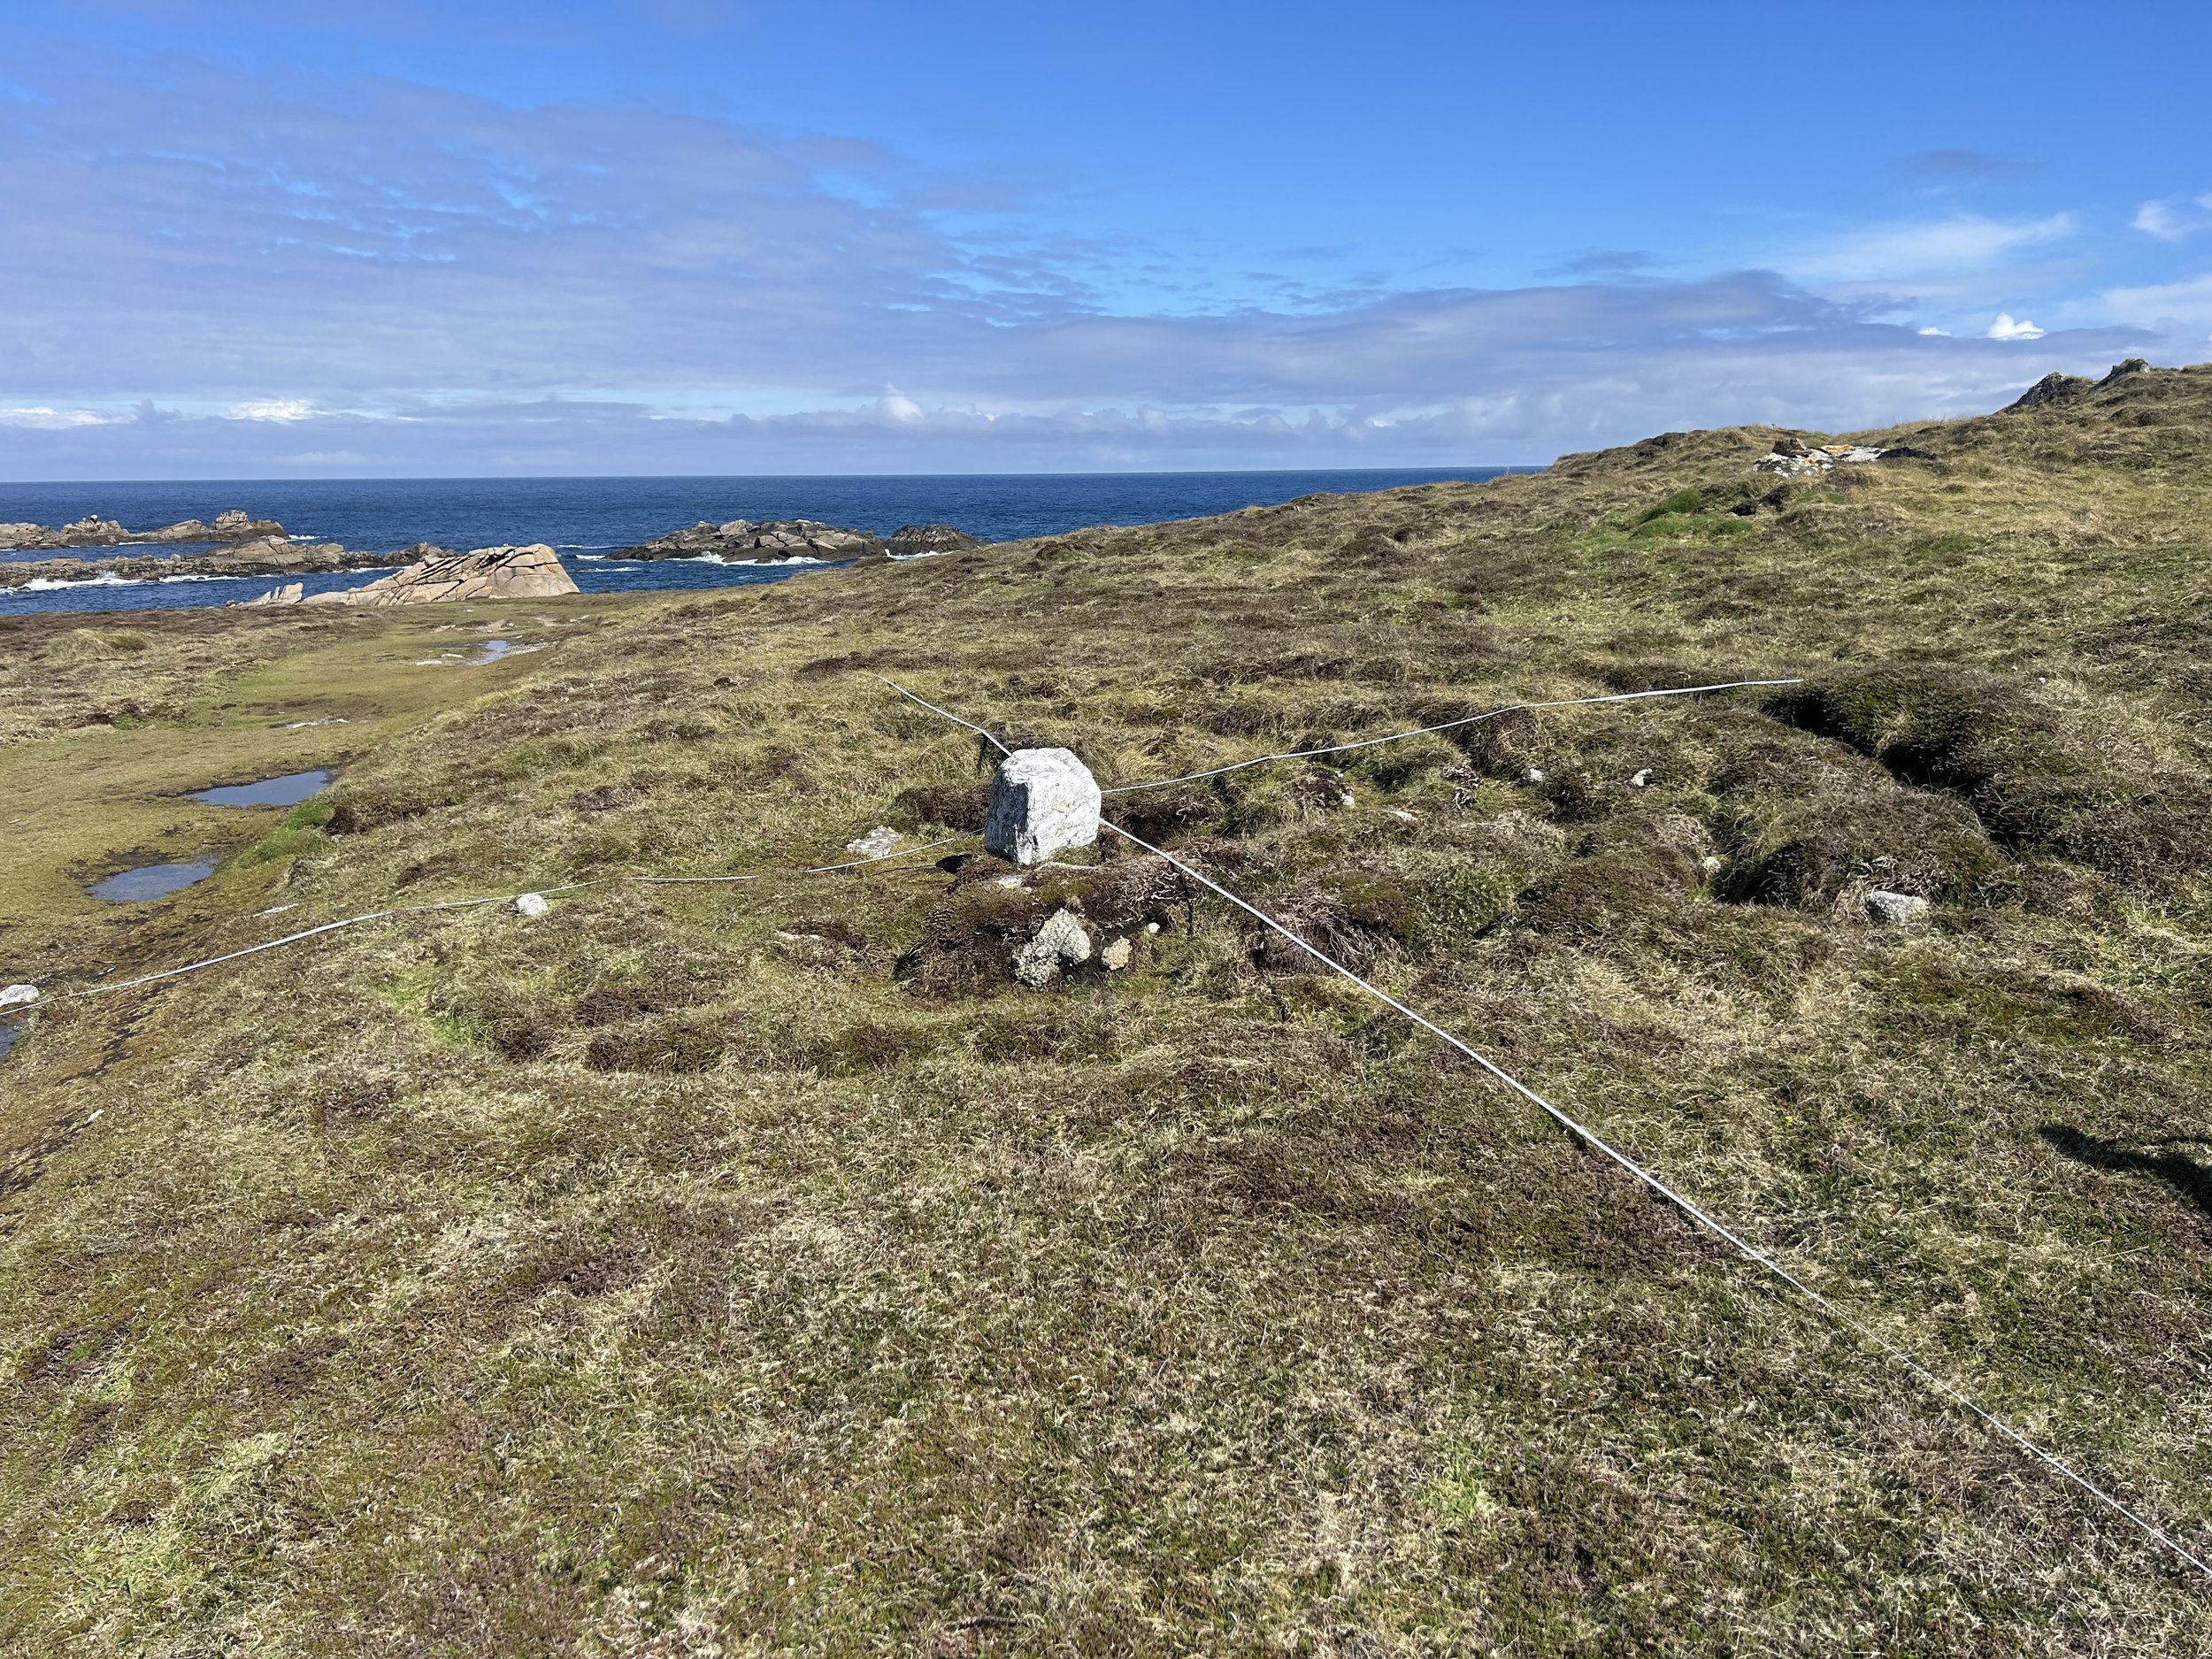
Our baselines overlaying Giant’s Castle Maze…
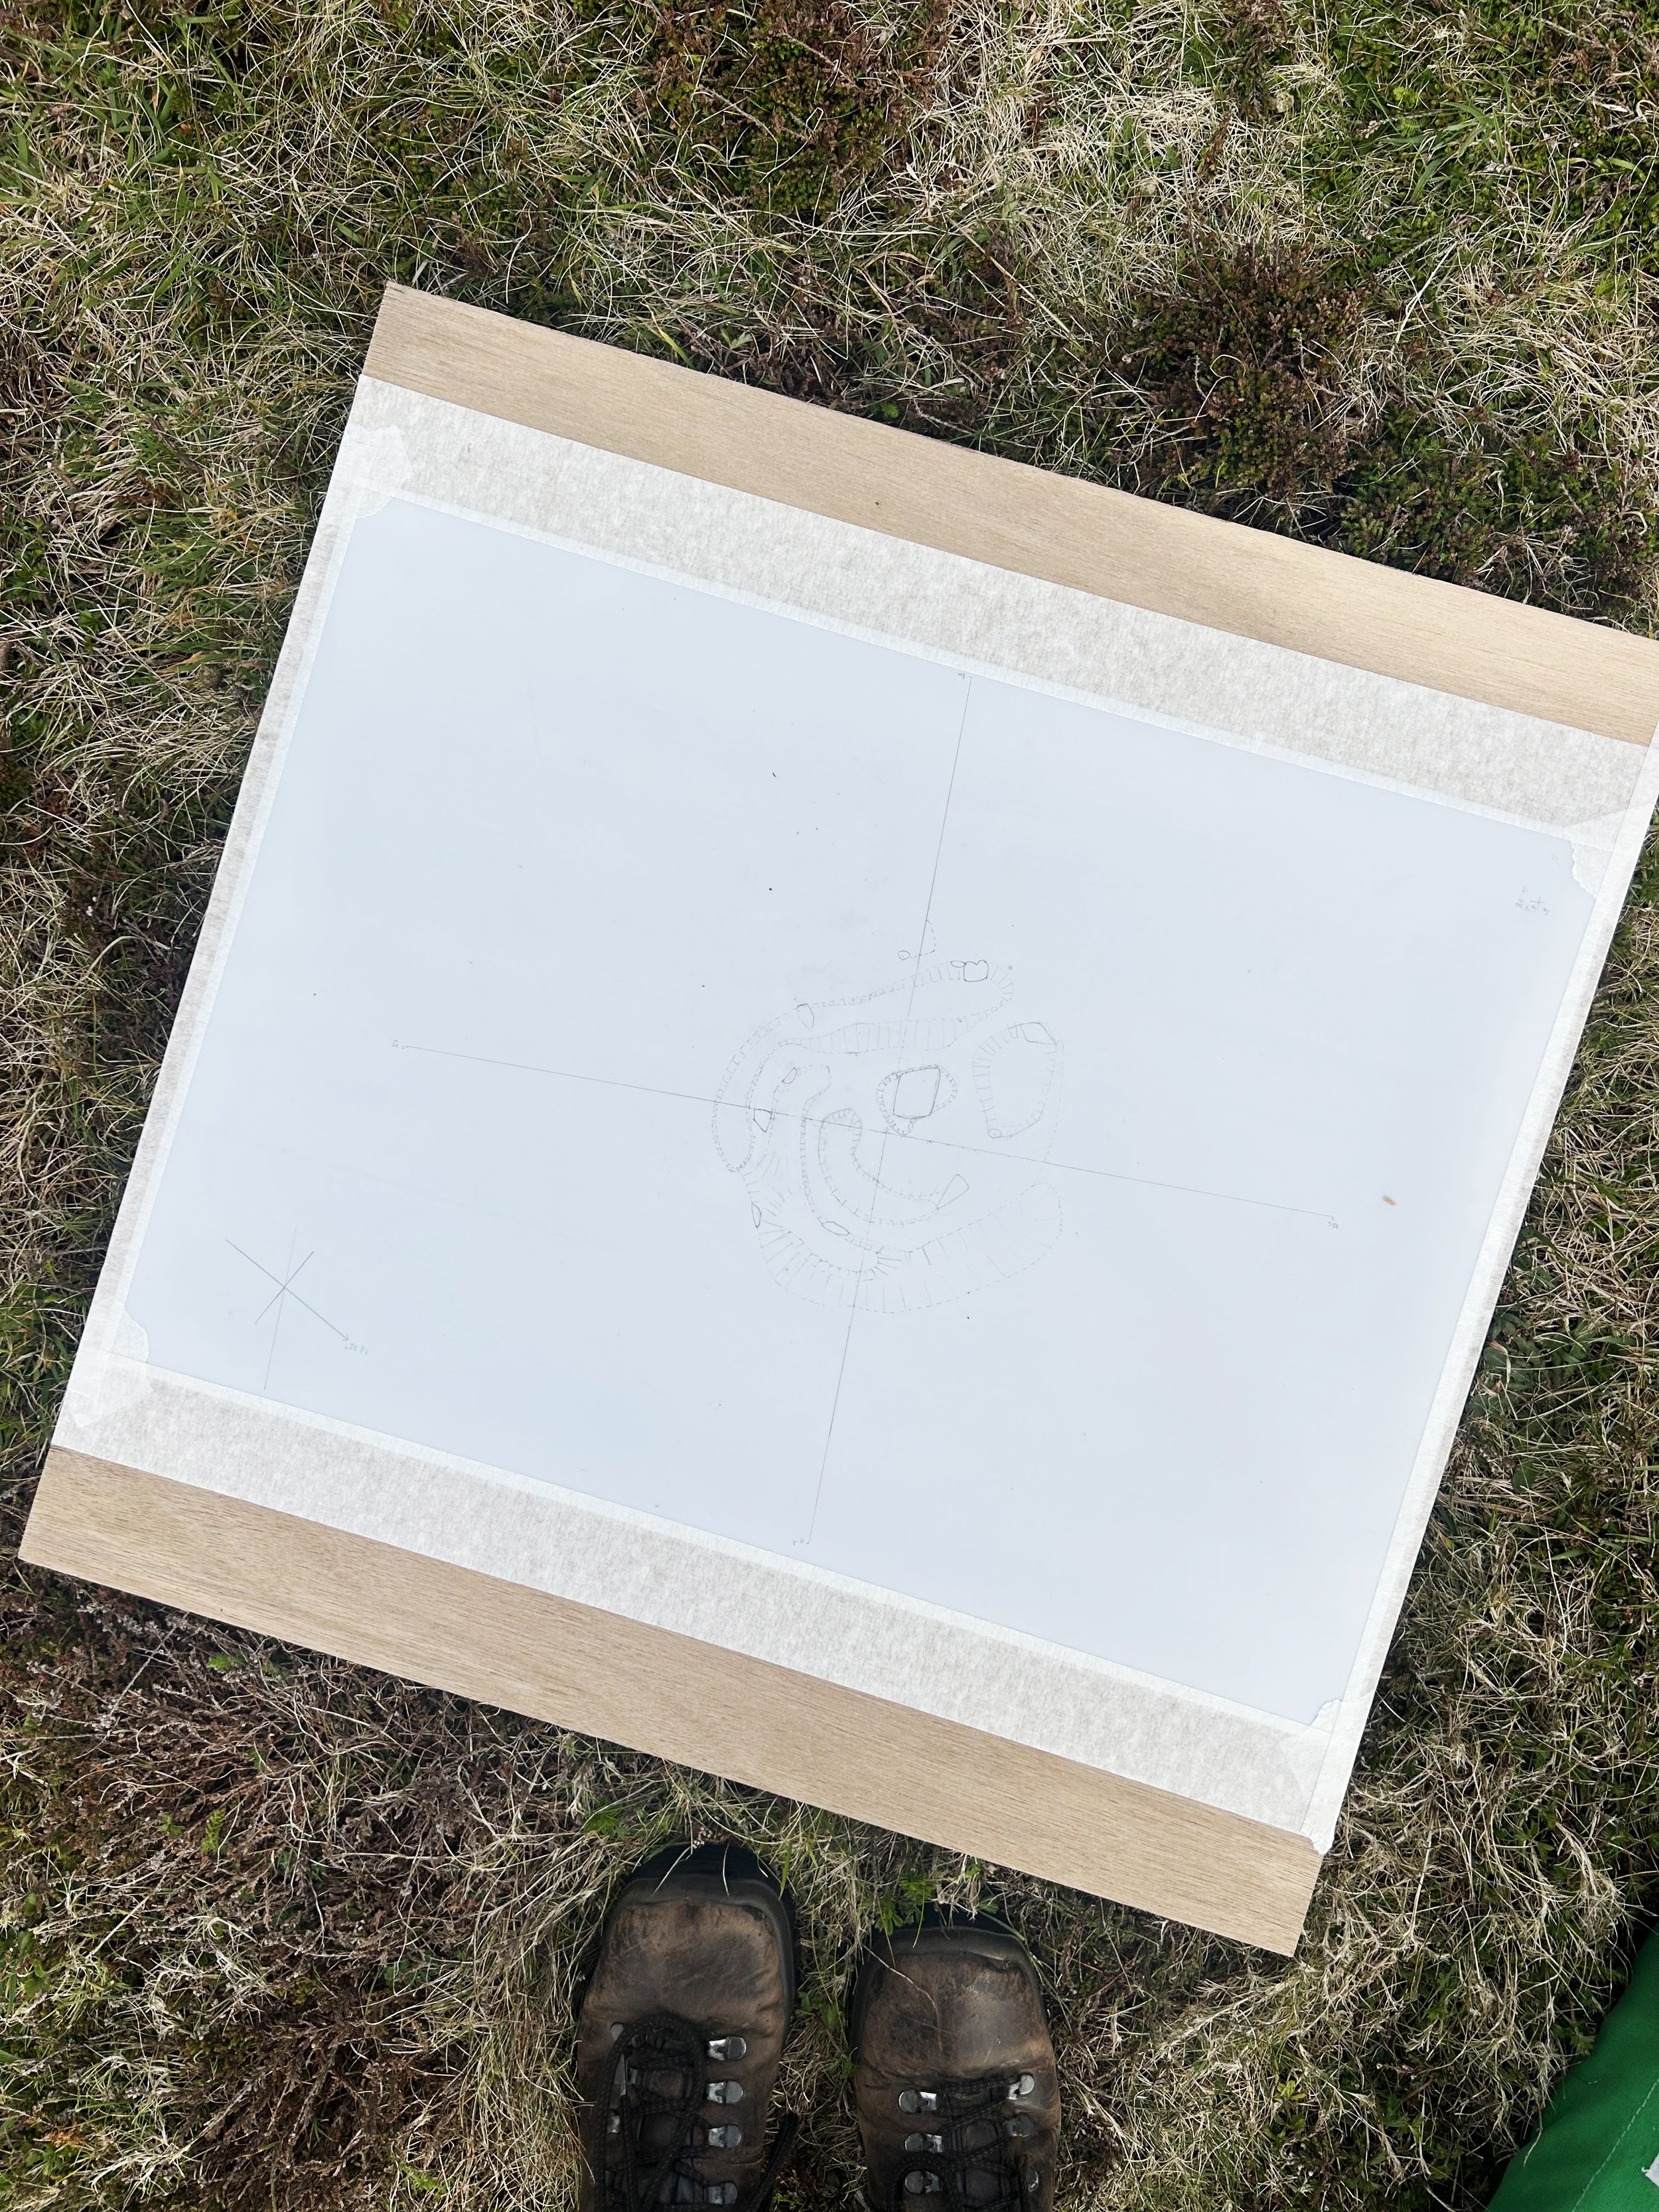
We decided on a scale of 1:20, meaning 2cm on the Maze was equal to 1mm on the board. We began from the center, and worked our way out to avoid confusion later. For every point we wanted to plot, Teän would measure the distance from one, then the other baseline, which we called x and y. Like a system of co-ordinates, we could accurately plot the relative positions of the stones and banks on the drawing. Every site measurement in centimeters needed to be divided by two to give the amount of milimeters on the board, which we did in our heads, and proved to be surprisingly difficult after hours of work in the hot sunshine.
We plotted all the visible rocks which didn’t move, usually with one point on each corner, and then joining them up, getting the shape by eye. We also plotted the position of the banks, whose start and end we decided between us, feeling our way over them in bare feet.
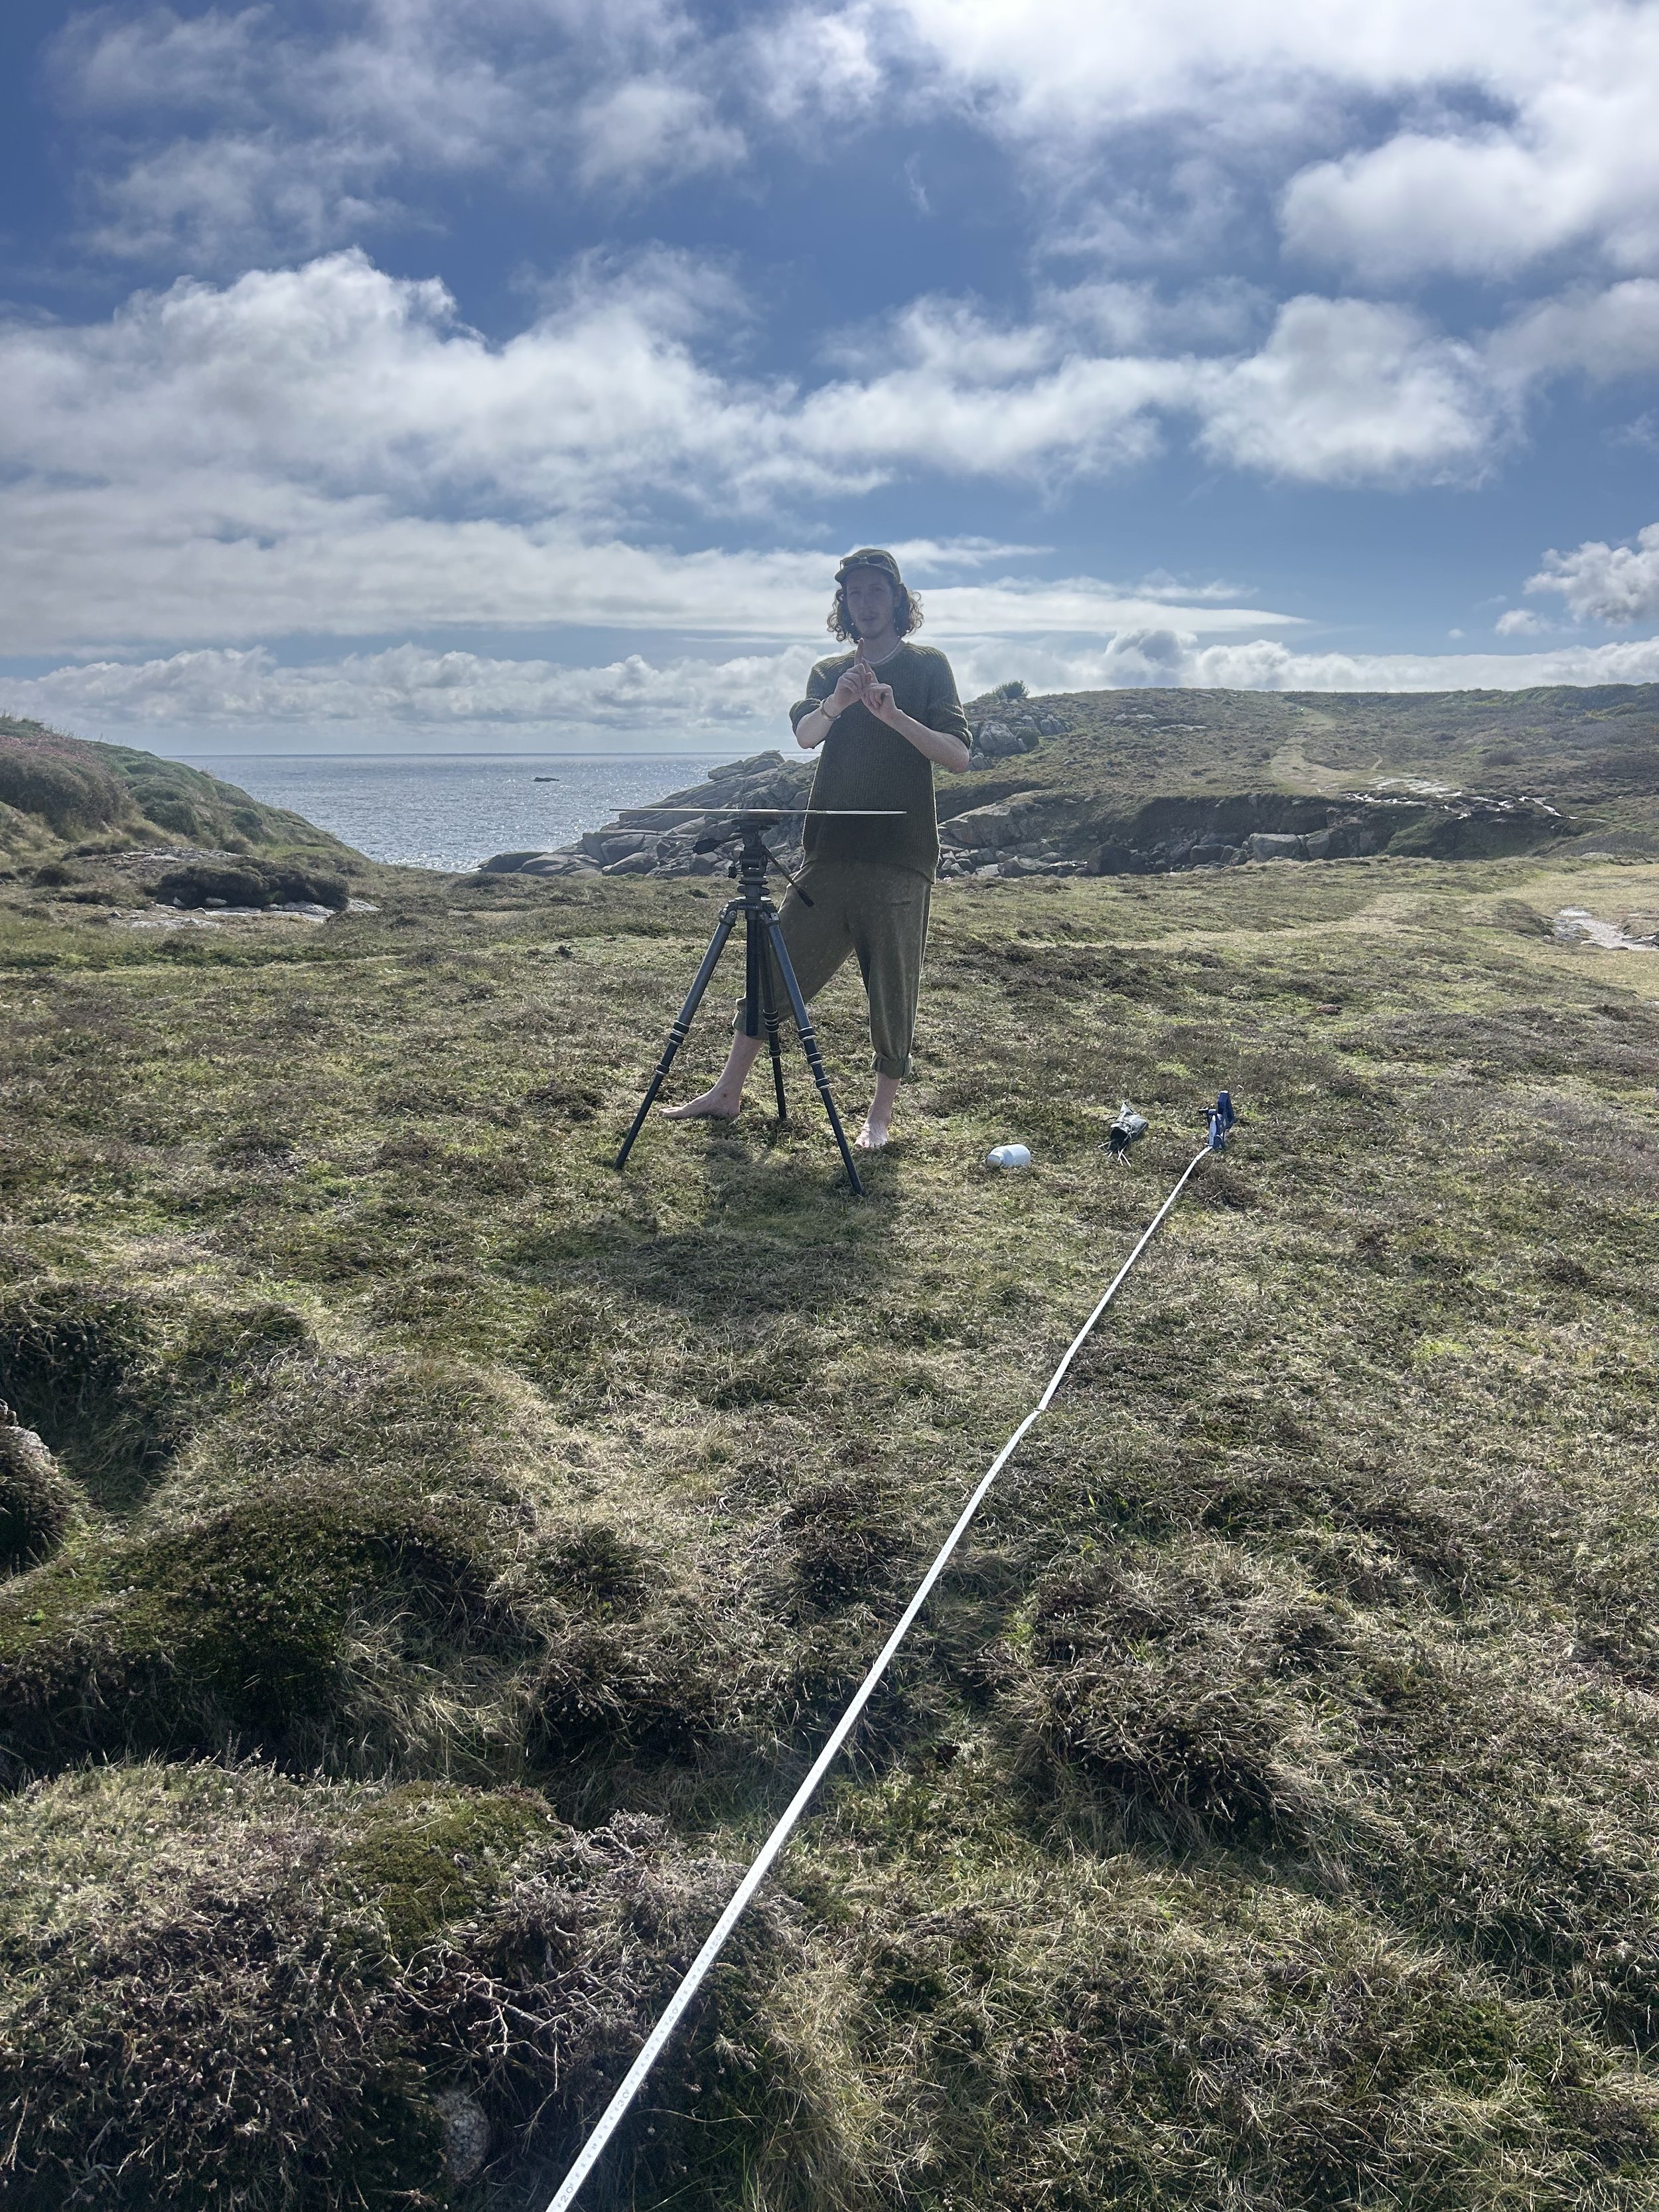
Layan with the drawing board…

The beginning of the survey, showing the central stone and two baselines…
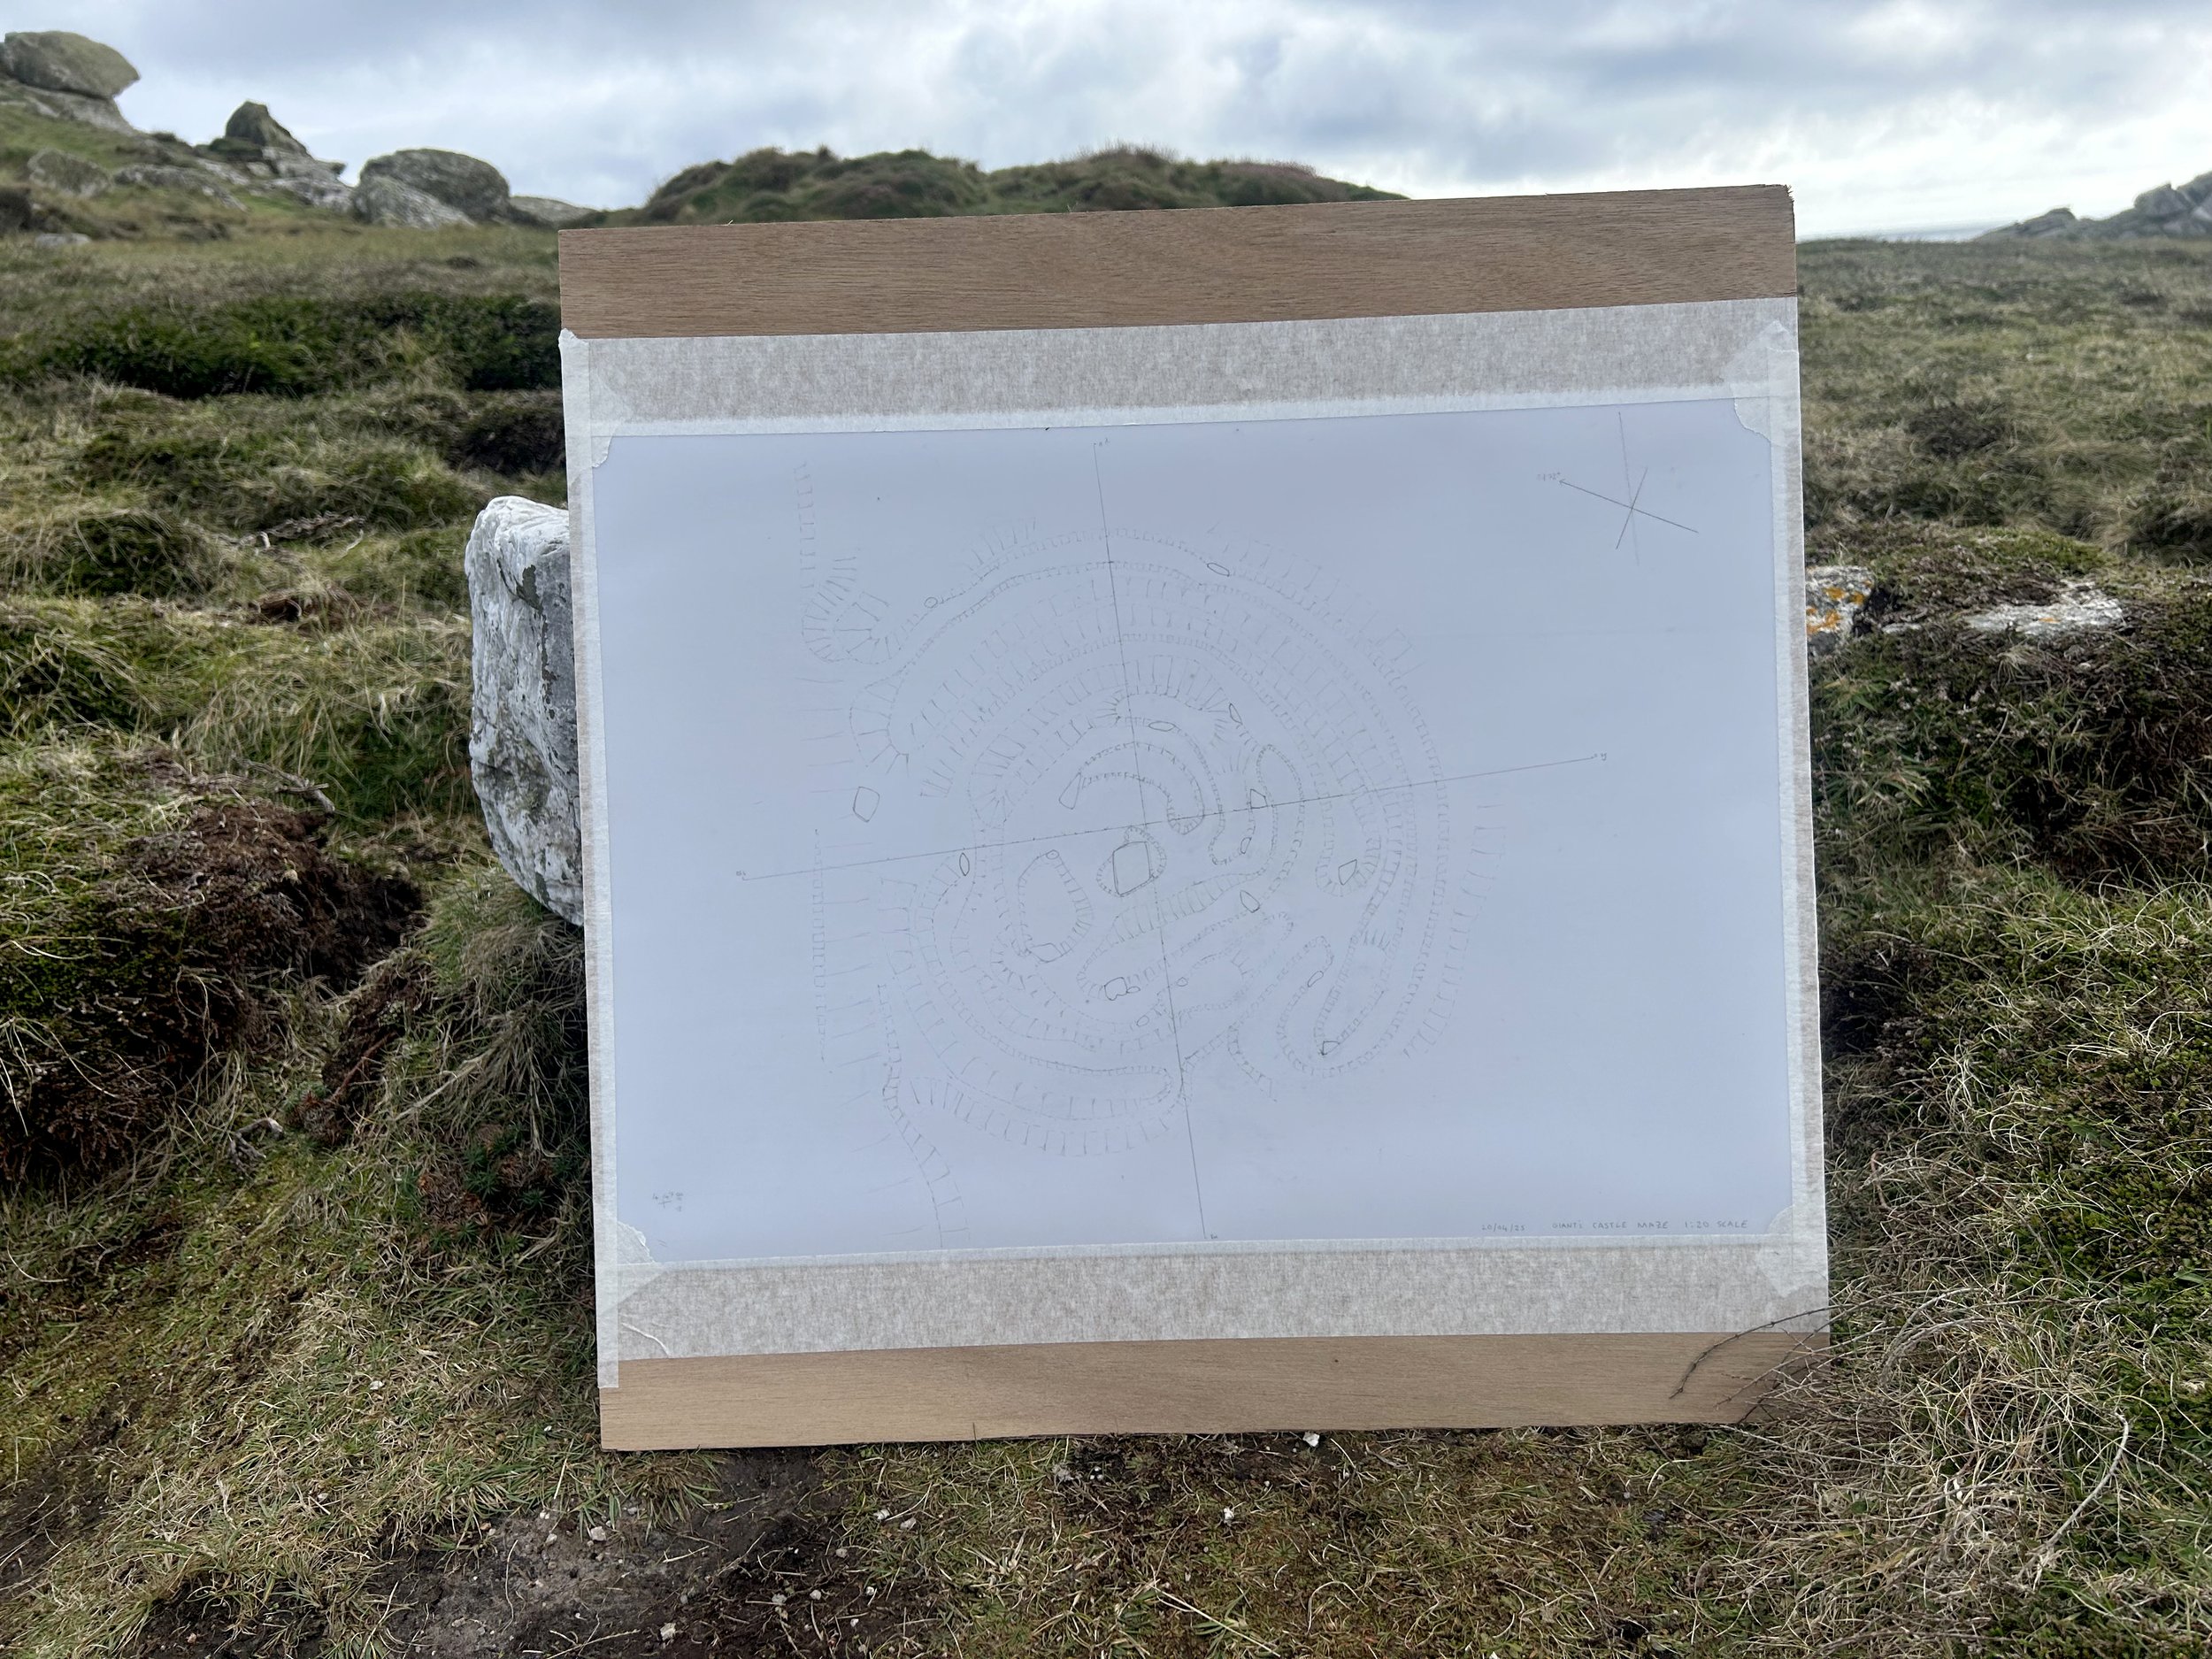
The slopes of the banks were illustrated using hachures, a common method of rendering slopes in archaeological surveys. A series of hatched lines are drawn perpendicular to the slope being illustrated. One end of each is thicker, and the thick end is at the top of the slope. The closer they are, the steeper the slope. It is very intuitive to look at once you get your eye in, and has a lot of beauty when done well. I tried my best to do justice to it.
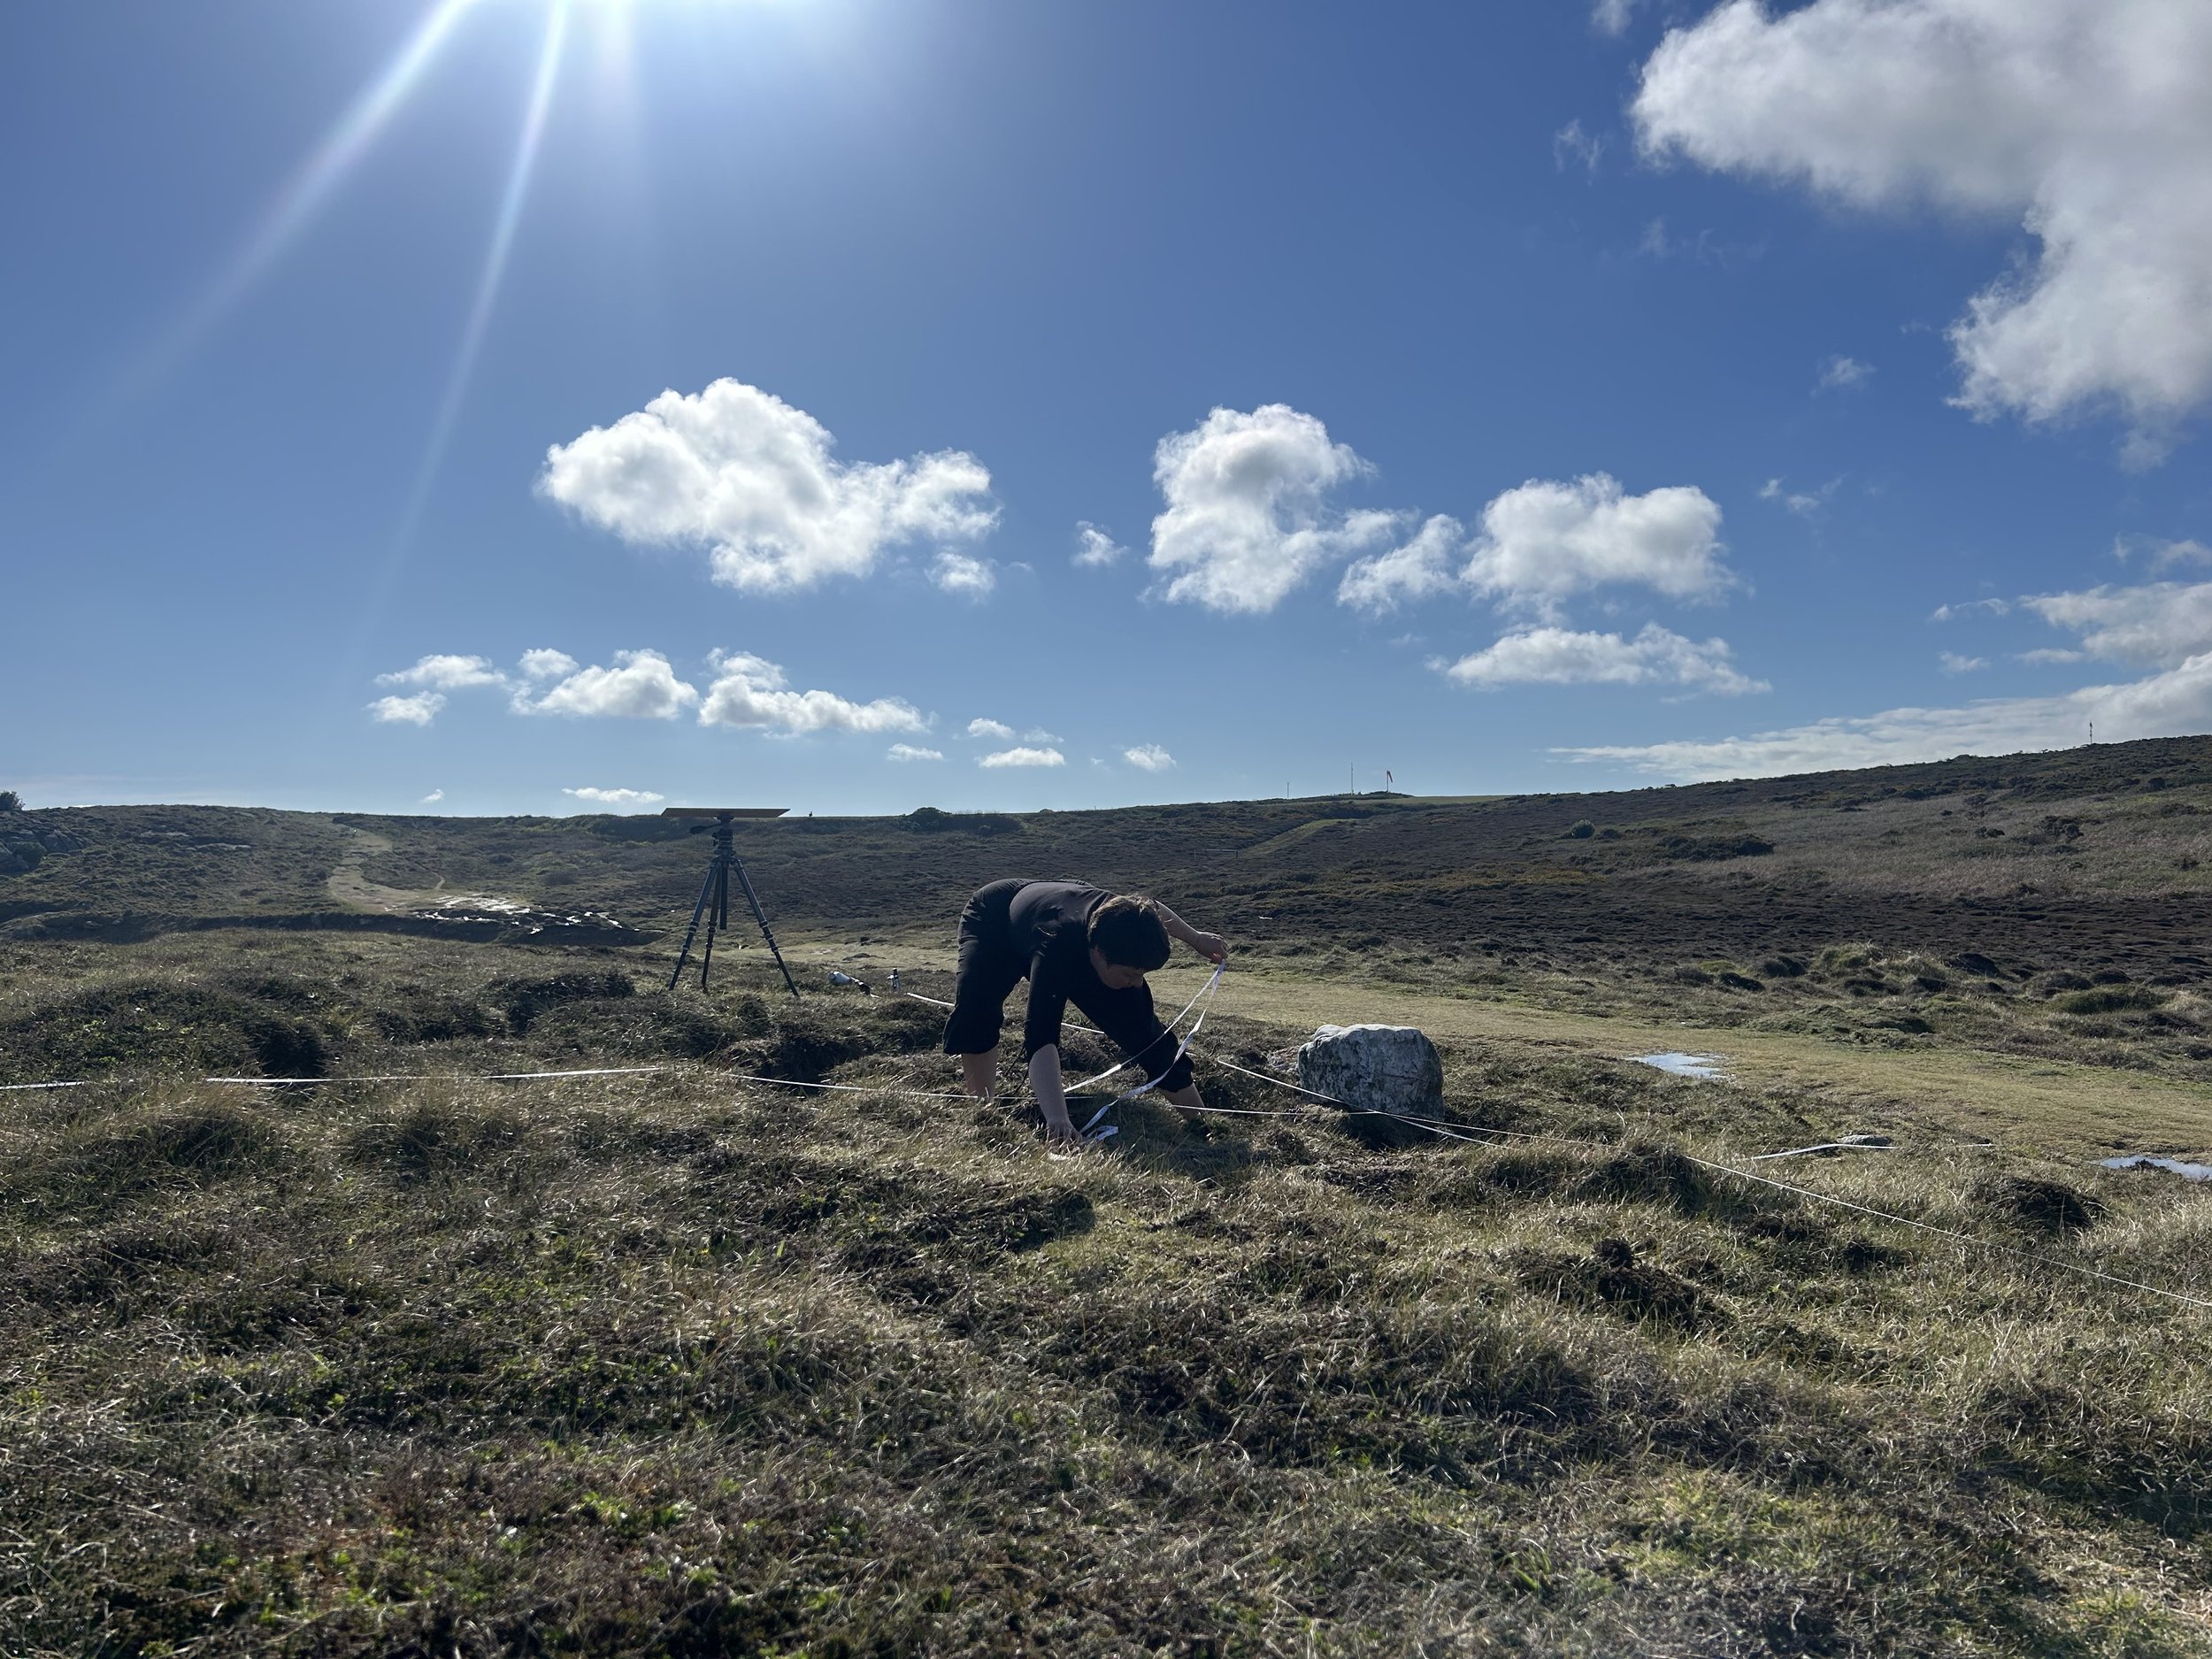
Teän taking measurements to be transferred to the drawing…
Our result at the end of day one…
The survey took two days, of about 6 hours each. We were blessed with beautiful sunshine throughout! I roughly showed the hachures on the first working draft, just enough to show where they should be, what direction they pointed, and how closely spaced to show the relative steepness of the slopes.
We included the feature of the puddle that had formed in the coast path next to the maze, which we were beginning to suspect had a significant part to play in this site, but more on that later…
End of Day One…

Start of Day Two…
The finished first draft of the survey at the Maze site…
The finished drawing in the centre of the Maze…
After the first draft was complete, I traced over it, neatening the hachures and labelling it properly. We included the position and direction of the coast path to help orientate by.
It was very interesting the level of the familiarity with each twist of the maze that we gained from doing this. It is an effect I have noticed before when doing an extended observational drawing, having sat with something for a long time, paying attention to everything that your focus would normally gloss over. I can still almost see the whole pattern of it in my mind’s eye. But this we observed not only with our eyes but with our hands and bare feet, a very tactile experience. We became aware of paths that are not apparent at first inspection, “ghost paths”, almost invisible, but detectible with the careful placing of feet. These we were able to include in our plan.
I think we both now feel much closer to the site, and more able to understand the journey of transformation it has been on in the decades it has weathered on the Scillonian coast. Importantly, we feel much more able to make informed guesses of how the routes of those paths once made a winding, walkable whole, and how it might again.
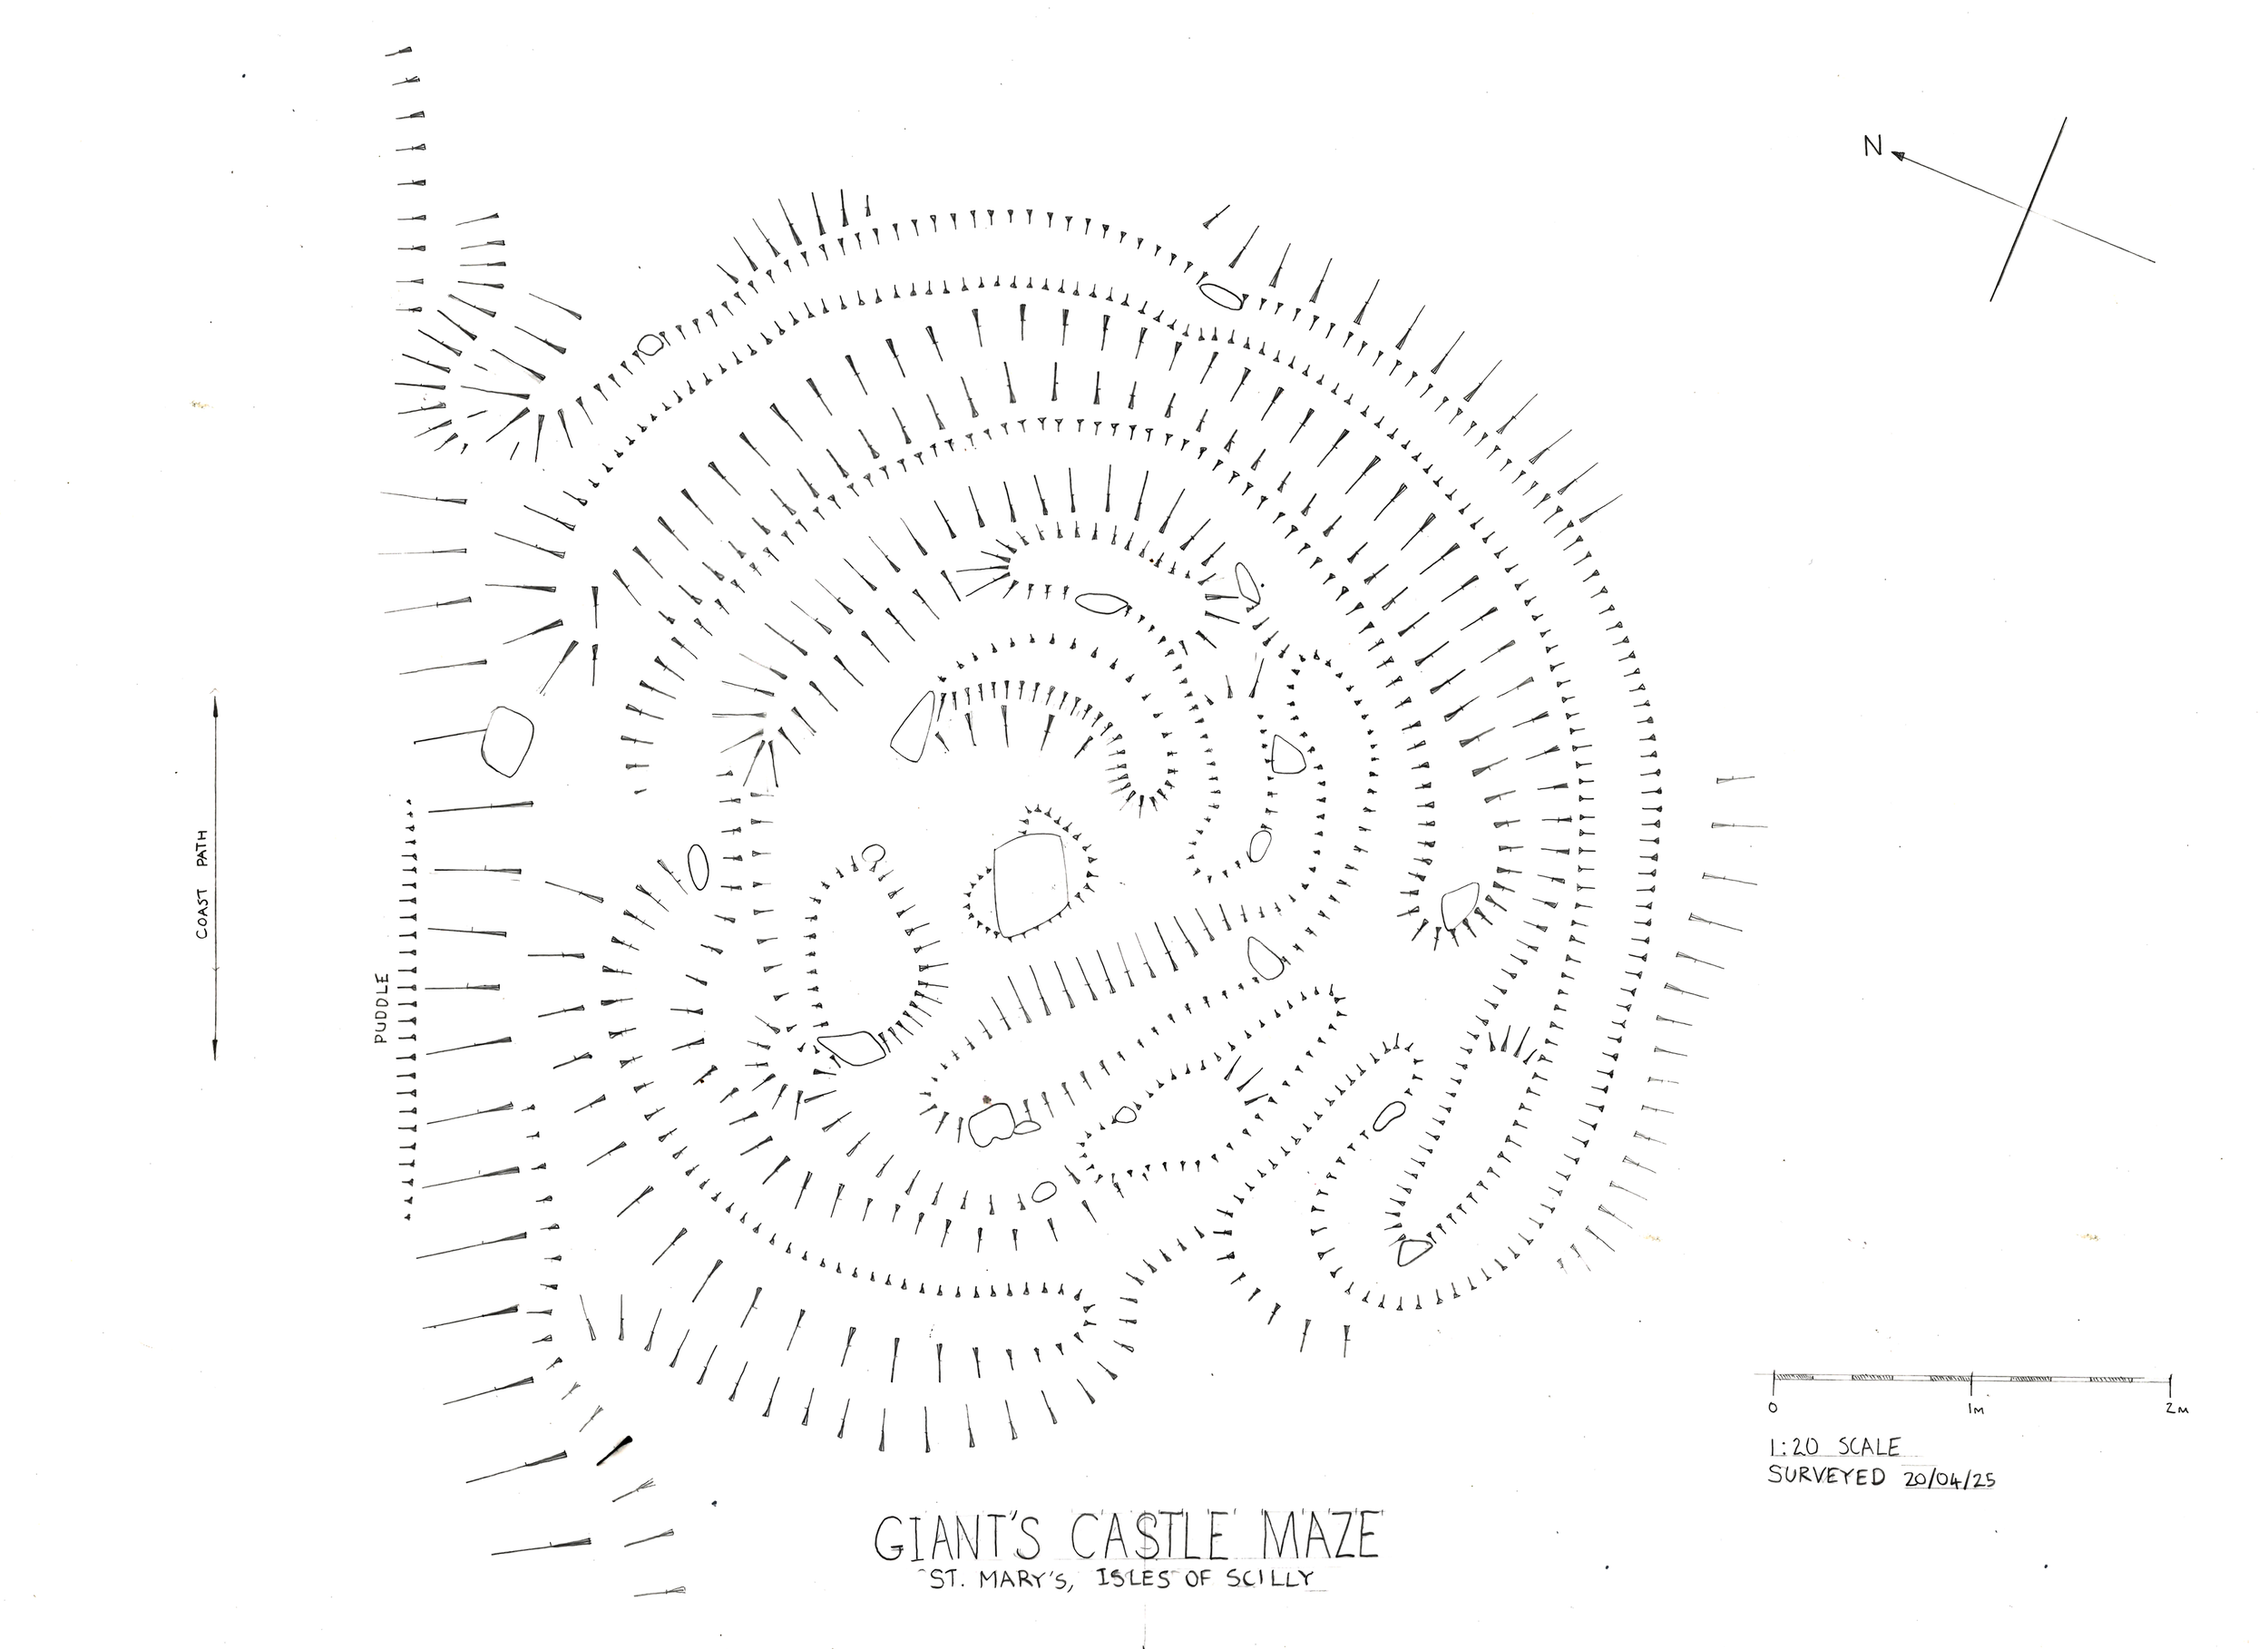
The completed survey of Giant’s Castle Maze.